Hurricane Michael (2018)
CATEGORY 5 SYSTEM PASSAGE
Hurricane Michael (October 2018)
STATION: KTPA • GULF TRANSIT & REVERSE NEGATIVE SURGE
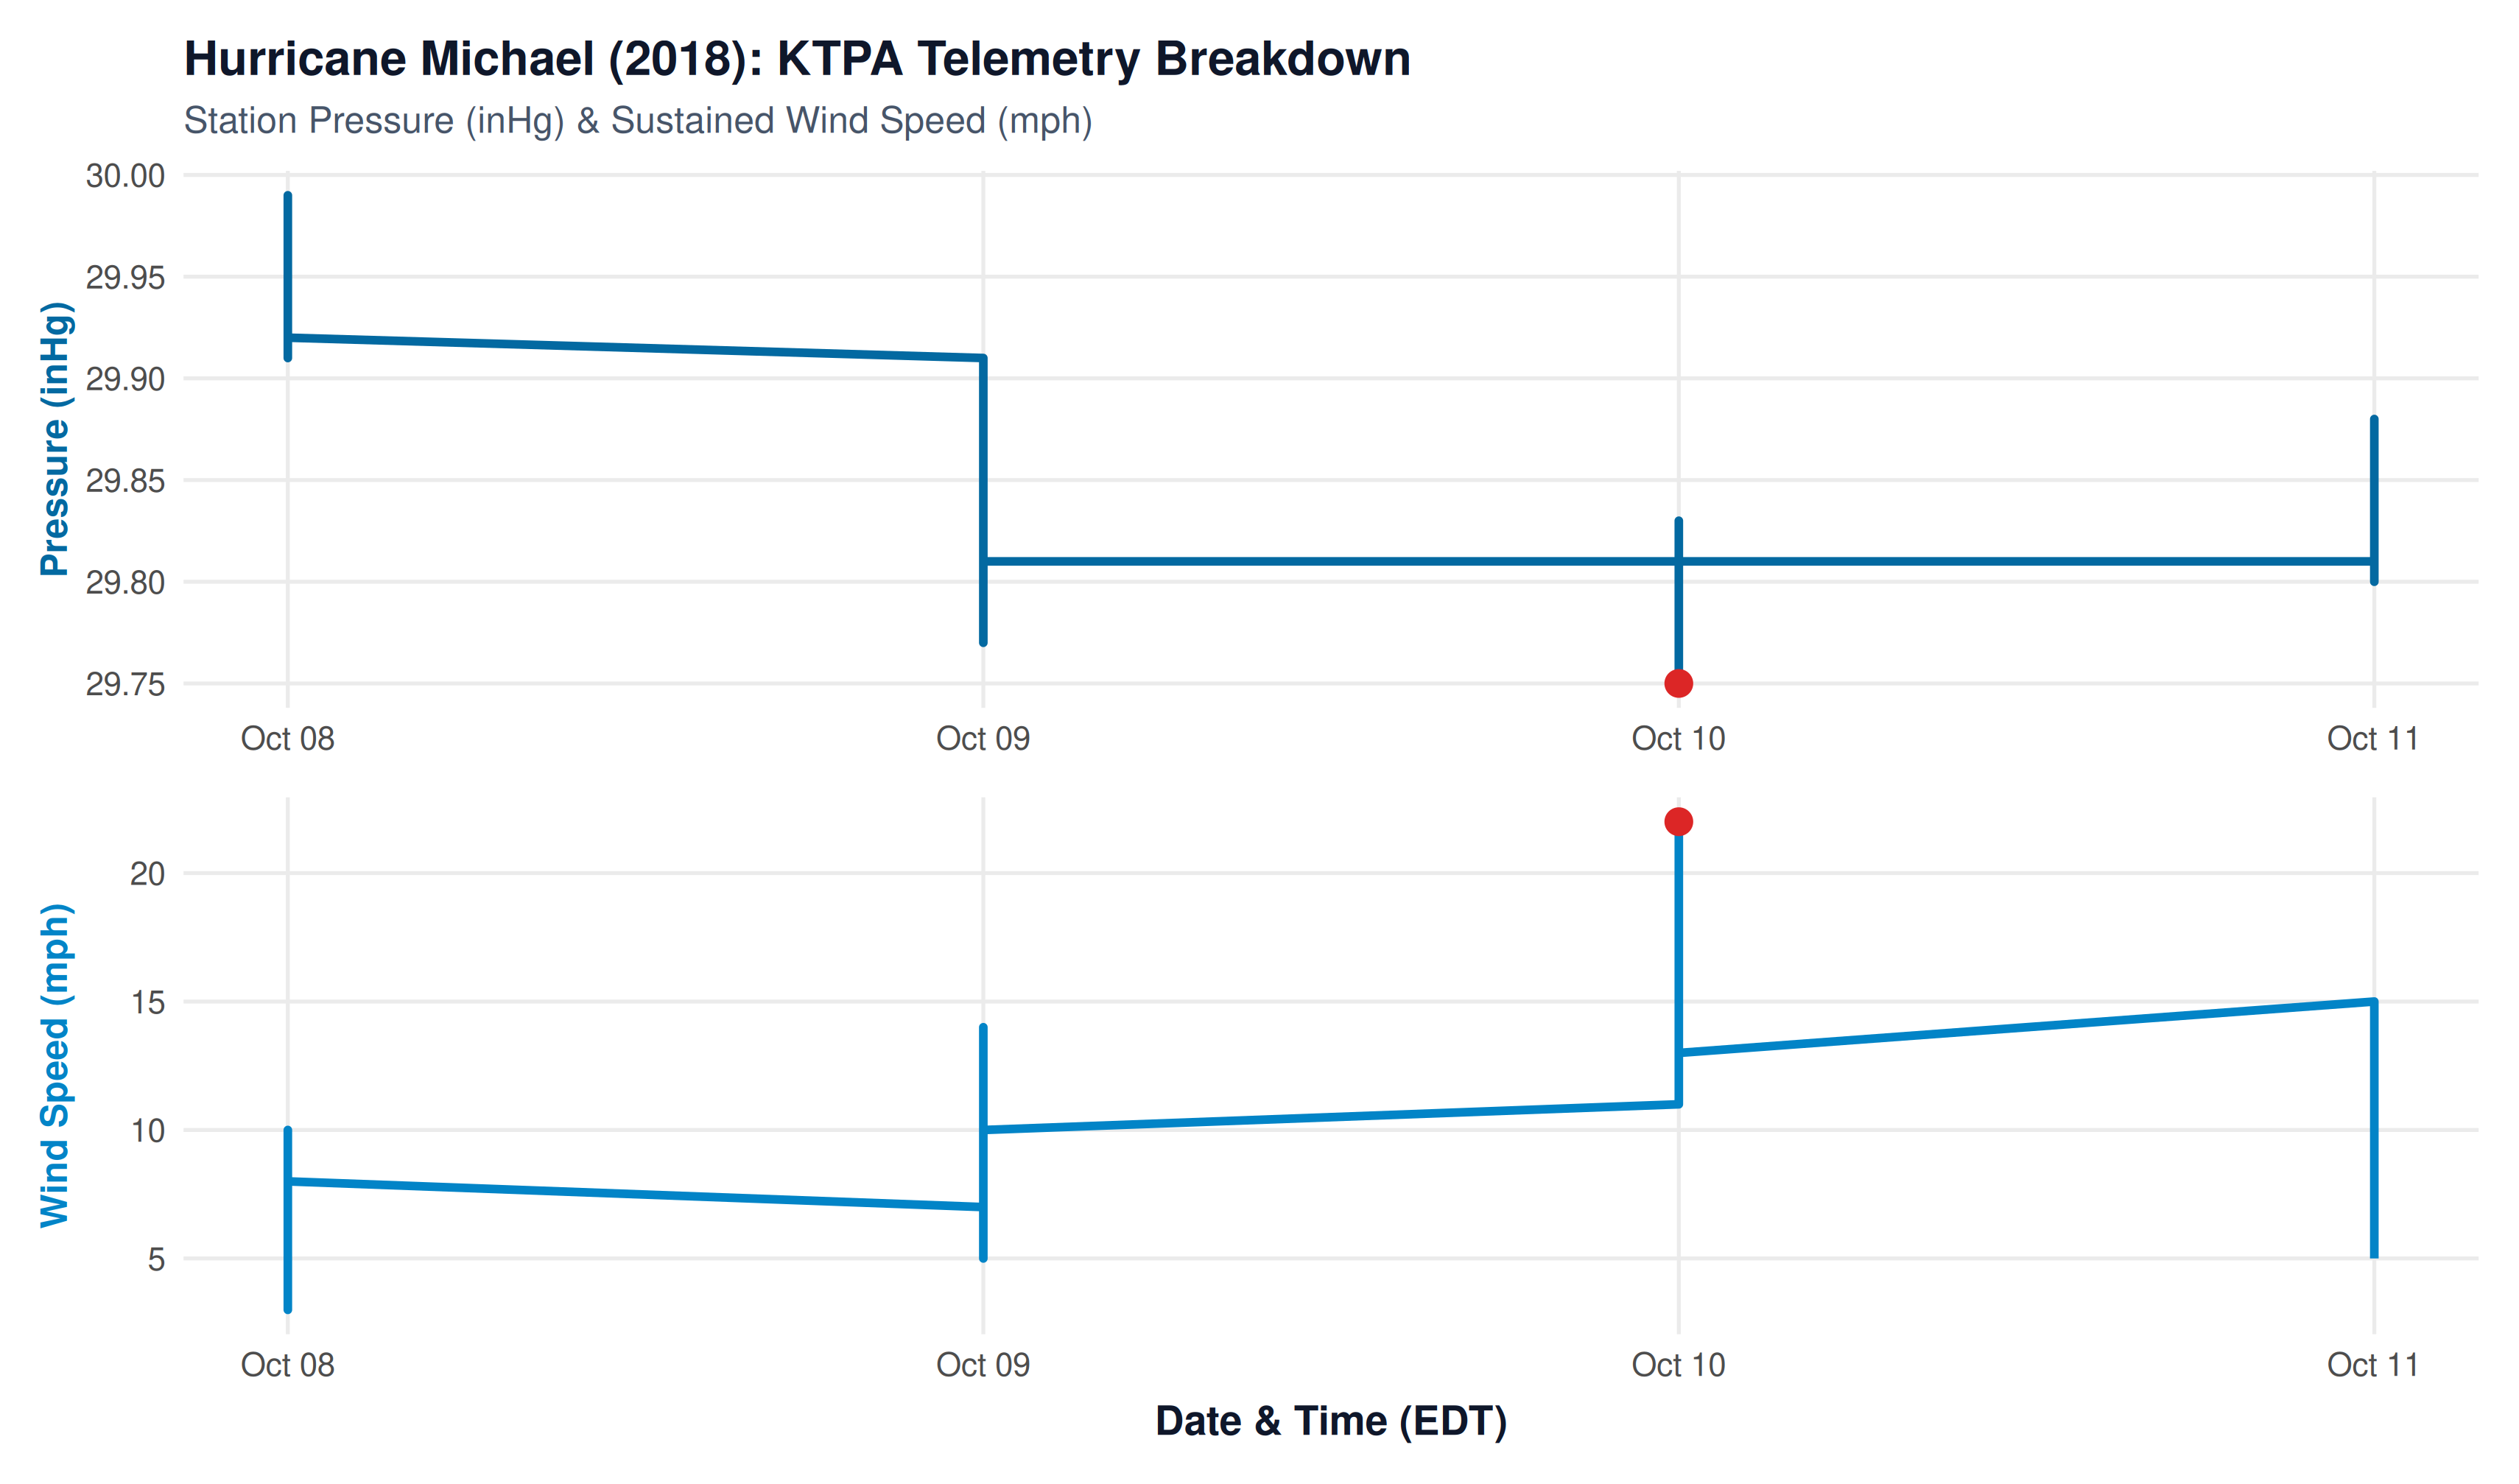
29.75 inHg
Lowest Pressure
1007.4 hPa on Oct 10
22.0 mph
Peak Sustained Wind
Gusts to 33 mph offshore flow
0.50 in
Storm Rainfall
Dry offshore slotting
-2.5 ft Drain
Bay Dynamics
Water siphoned into Gulf
Synoptic Evolution & Gulf Transit
In early October 2018, Hurricane Michael underwent explosive rapid intensification over the warm waters of the eastern Gulf of Mexico, deepening into an historic Category 5 hurricane with 160 mph sustained winds before devastating Mexico Beach and the Florida Panhandle.
While Michael’s center remained 200 miles west of Tampa as it rocketed north toward the Panhandle, its enormous wind field and intense low pressure exerted a profound hydrodynamic impact on Tampa Bay’s coastal waters.
Meteorological Telemetry at KTPA
Despite Michael’s core remaining far offshore, KTPA’s automated sensors clearly chronicled the cyclone’s passage:
- Broad Pressure Deficit: Station pressure dipped to 29.75 inHg on October 10 as Michael reached peak Category 5 intensity off the Florida coast.
- Reverse Negative Storm Surge: As Michael churned to the west, its counterclockwise winds drove steady northeasterly and easterly breezes across Tampa Bay. This continuous offshore gale pushed bay water toward the Gulf, lowering water levels across Hillsborough Bay by 2 to 2.5 feet below normal astronomical tide.
- Dry Slotting: Unlike Hermine or Debby, Tampa Bay found itself in a continental dry slot behind Michael’s eastern rainbands, holding storm rainfall to just 0.50 inches at KTPA.
Hurricane Michael Landfall: Shape, Rotation & Wind Circulation
The interactive simulation below reconstructs Hurricane Michael at mainland Florida landfall near Mexico Beach (Cat 5, 160 mph). It visualizes the storm’s intense cyclonic rainbands, counter-clockwise rotation, and the resulting offshore easterly gales that created a reverse negative surge in Tampa Bay.
REAL-TIME ROTATION SIMULATOR
Hurricane Michael: Animated Cloud Formation & Cyclonic Wind Field
Interactive 60fps canvas simulation: counter-clockwise cyclonic spin of convective cloud bands and wind field points with inward surface inflow deflection.
NoteExplore More Weather Crises
Return to the Natural Disasters Overview to view the full 10-year timeline, comparison tables, and summaries of all major storms.