Hurricane Idalia (2023)
HIGH-TIDE SURGE INUNDATION
Hurricane Idalia (August 2023)
STATION: KTPA • KING TIDE SURGE & RECORD BAYSHORE INUNDATION
29.55 inHg
Lowest Pressure
1000.7 hPa on Aug 30
33.0 mph
Peak Sustained Wind
Gusts to 52 mph onshore
2.68 in
Storm Rainfall
Outer squall bands
4.0 – 5.0 ft
Peak Storm Surge
Inundated Bayshore & Davis Is.
Synoptic Evolution & Gulf Acceleration
In late August 2023, Hurricane Idalia rapidly intensified over exceptionally warm eastern Gulf waters, ballooning into a Category 4 major hurricane before making landfall in Florida’s Big Bend as a Category 3 storm on August 30.
Although Idalia tracked roughly 120 miles west of Tampa Bay, its eastern flank unleashed persistent southerly and southwesterly gales that pushed Gulf water directly into the mouth of Tampa Bay. Crucially, the surge arrived precisely during an astronomical King Tide (supermoon peak).
Meteorological Telemetry at KTPA
KTPA’s telemetry documented the dynamics of a high-tide surge disaster:
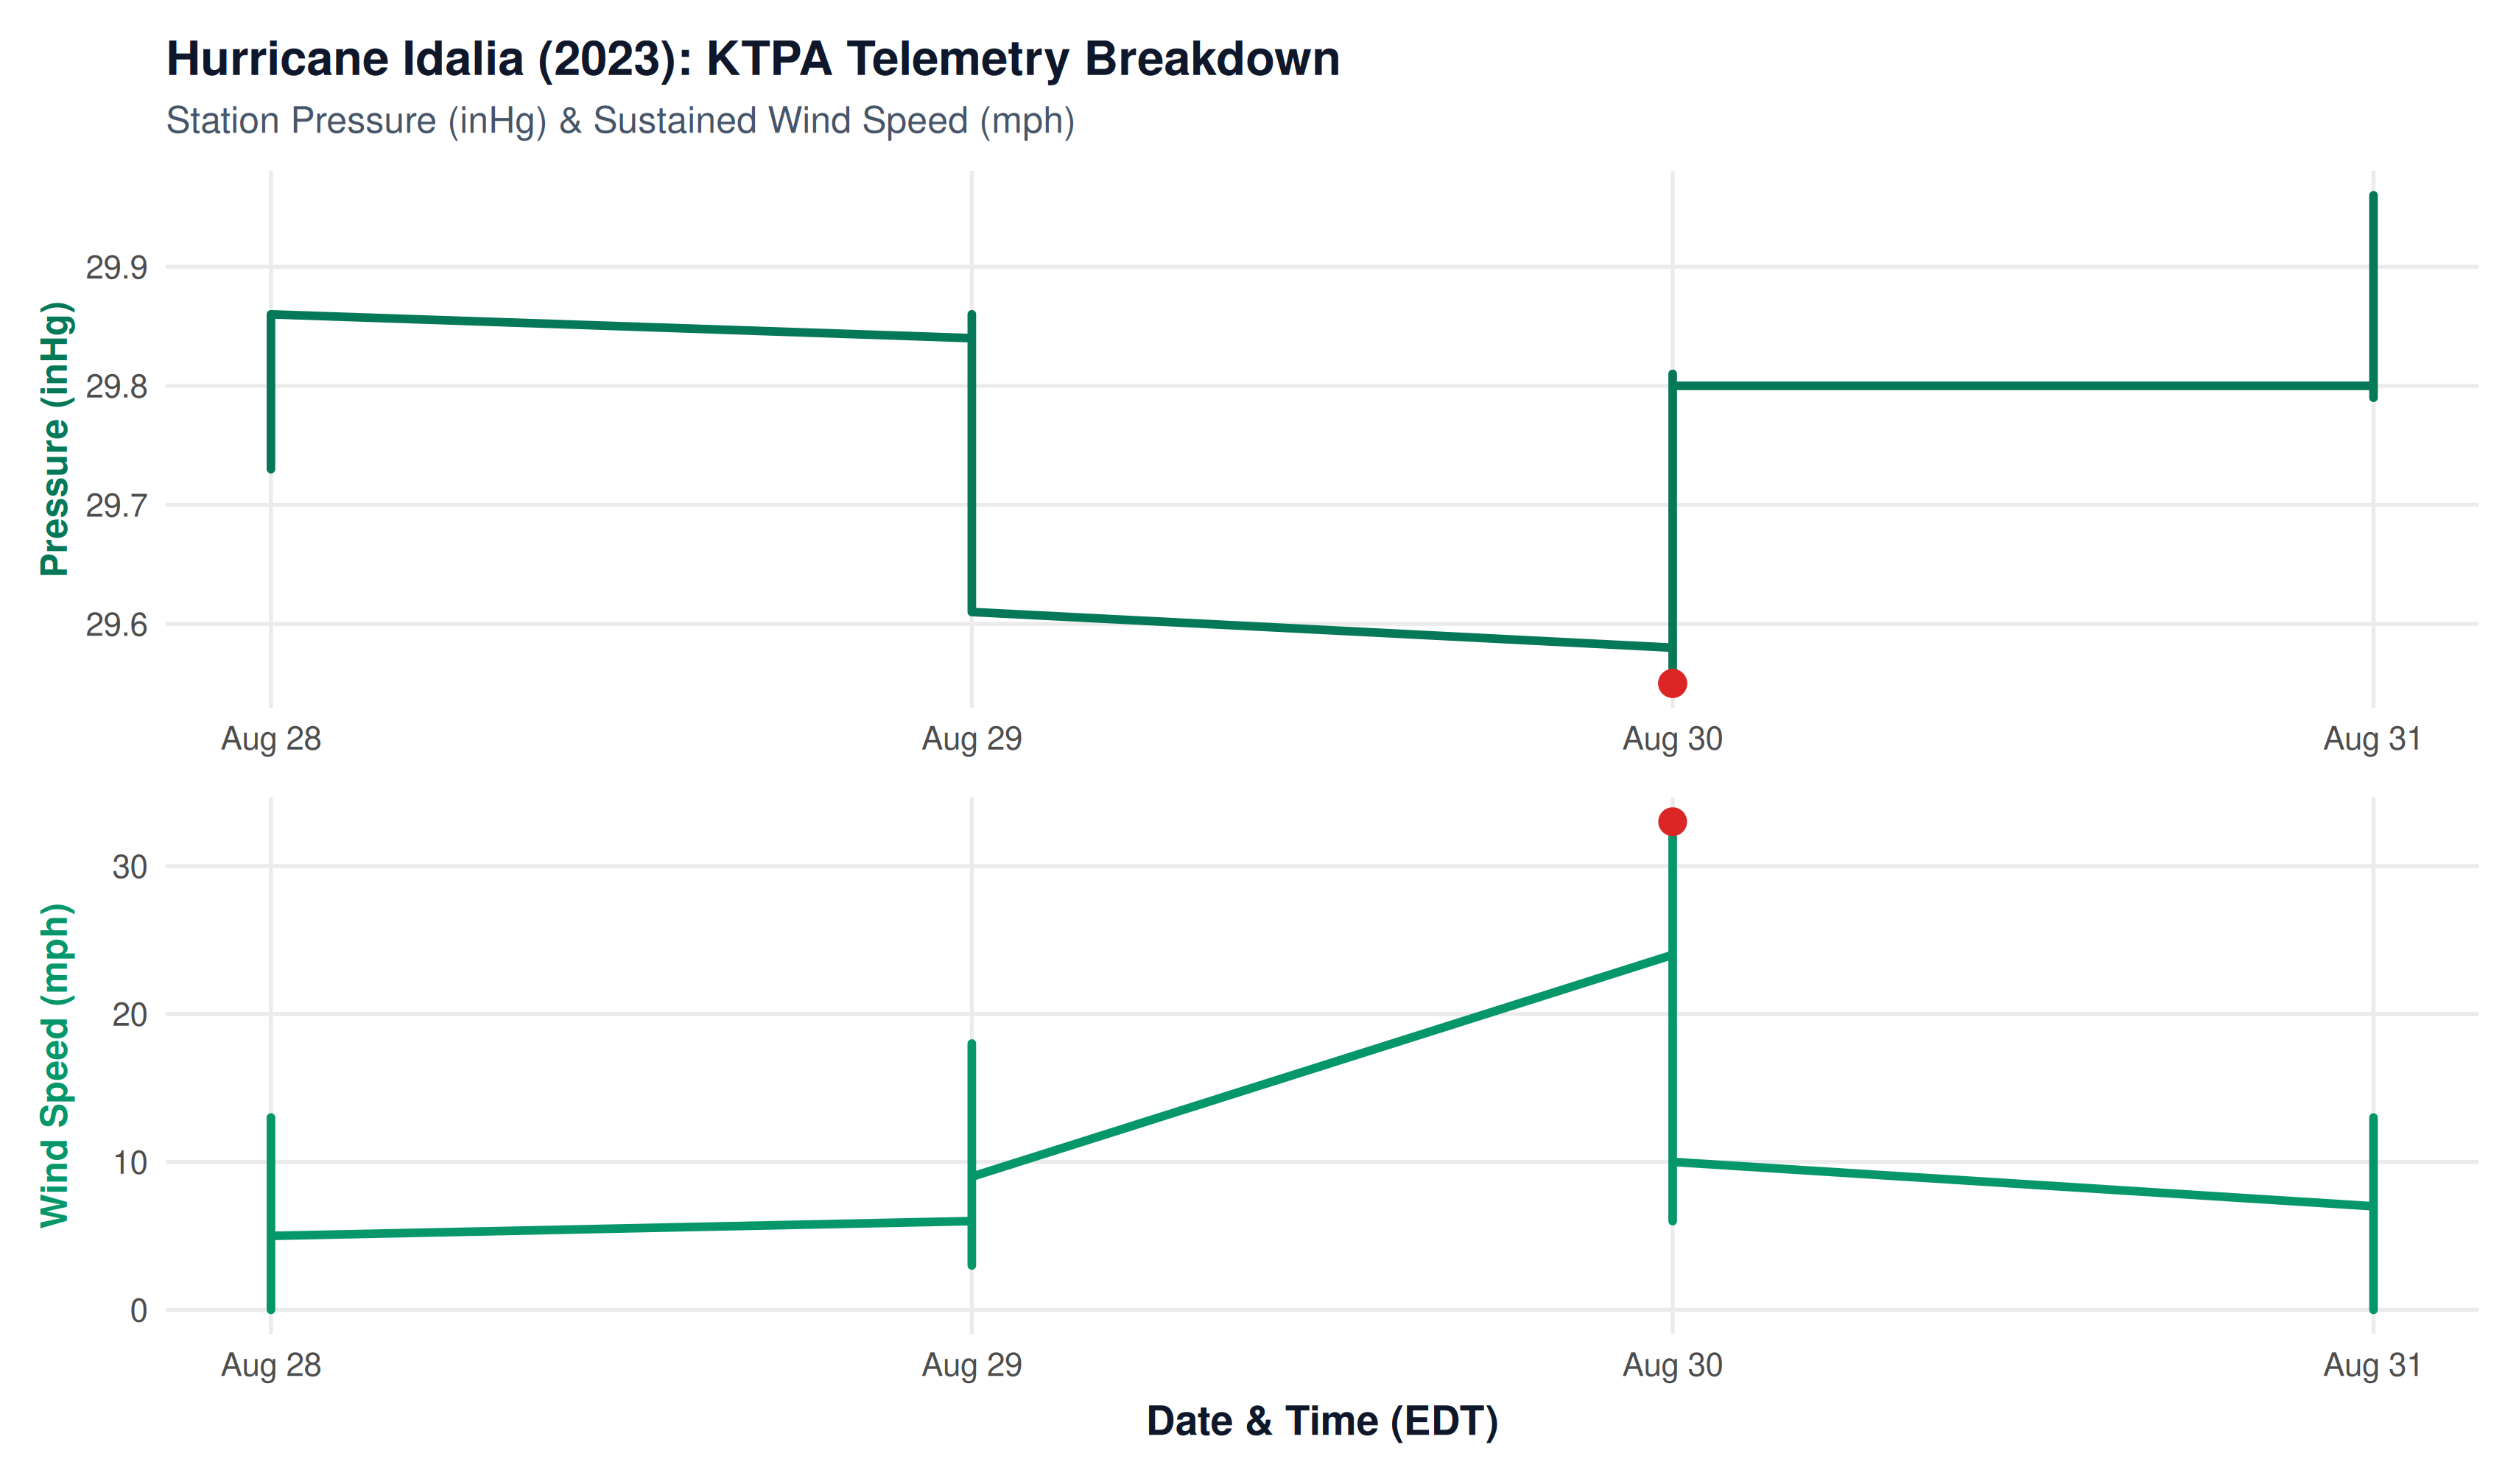
- Pressure & Wind Signature: Station pressure fell to 29.55 inHg on August 30, with sustained onshore winds of 33 mph and squall gusts over 50 mph driving ocean water inland.
- Unprecedented Coastal Inundation: The combined astronomical King Tide and 4 to 5 foot surge pushed Tampa Bay to its highest water level since 1993 at the time. Water completely submerged Bayshore Boulevard, flowed through ground-floor condominiums on Davis Islands, and cut off access to Gulf beach communities in St. Petersburg and Clearwater.
- Rainfall Total: Outer bands dropped 2.68 inches of rain at KTPA, while the primary damage was caused by saltwater flooding.
Hurricane Idalia Landfall: Shape, Rotation & Wind Circulation
The interactive simulation below reconstructs Hurricane Idalia at mainland Florida landfall near Keaton Beach (Cat 3, 125 mph). It visualizes the storm’s cyclonic rainbands, counter-clockwise rotation, and the resulting onshore southwesterly winds that triggered historic high-tide coastal surge across Bayshore Boulevard.
REAL-TIME ROTATION SIMULATOR
Hurricane Idalia: Animated Cloud Formation & Cyclonic Wind Field
Interactive 60fps canvas simulation: counter-clockwise cyclonic spin of convective cloud bands and wind field points with inward surface inflow deflection.
NoteExplore More Weather Crises
Return to the Natural Disasters Overview to view the full 10-year timeline, comparison tables, and summaries of all major storms.