Hurricane Ian (2022)
CATEGORY 4/5 NEAR-MISS & NEGATIVE SURGE
Hurricane Ian (September 2022)
STATION: KTPA • MASSIVE DRAIN OF TAMPA BAY BED
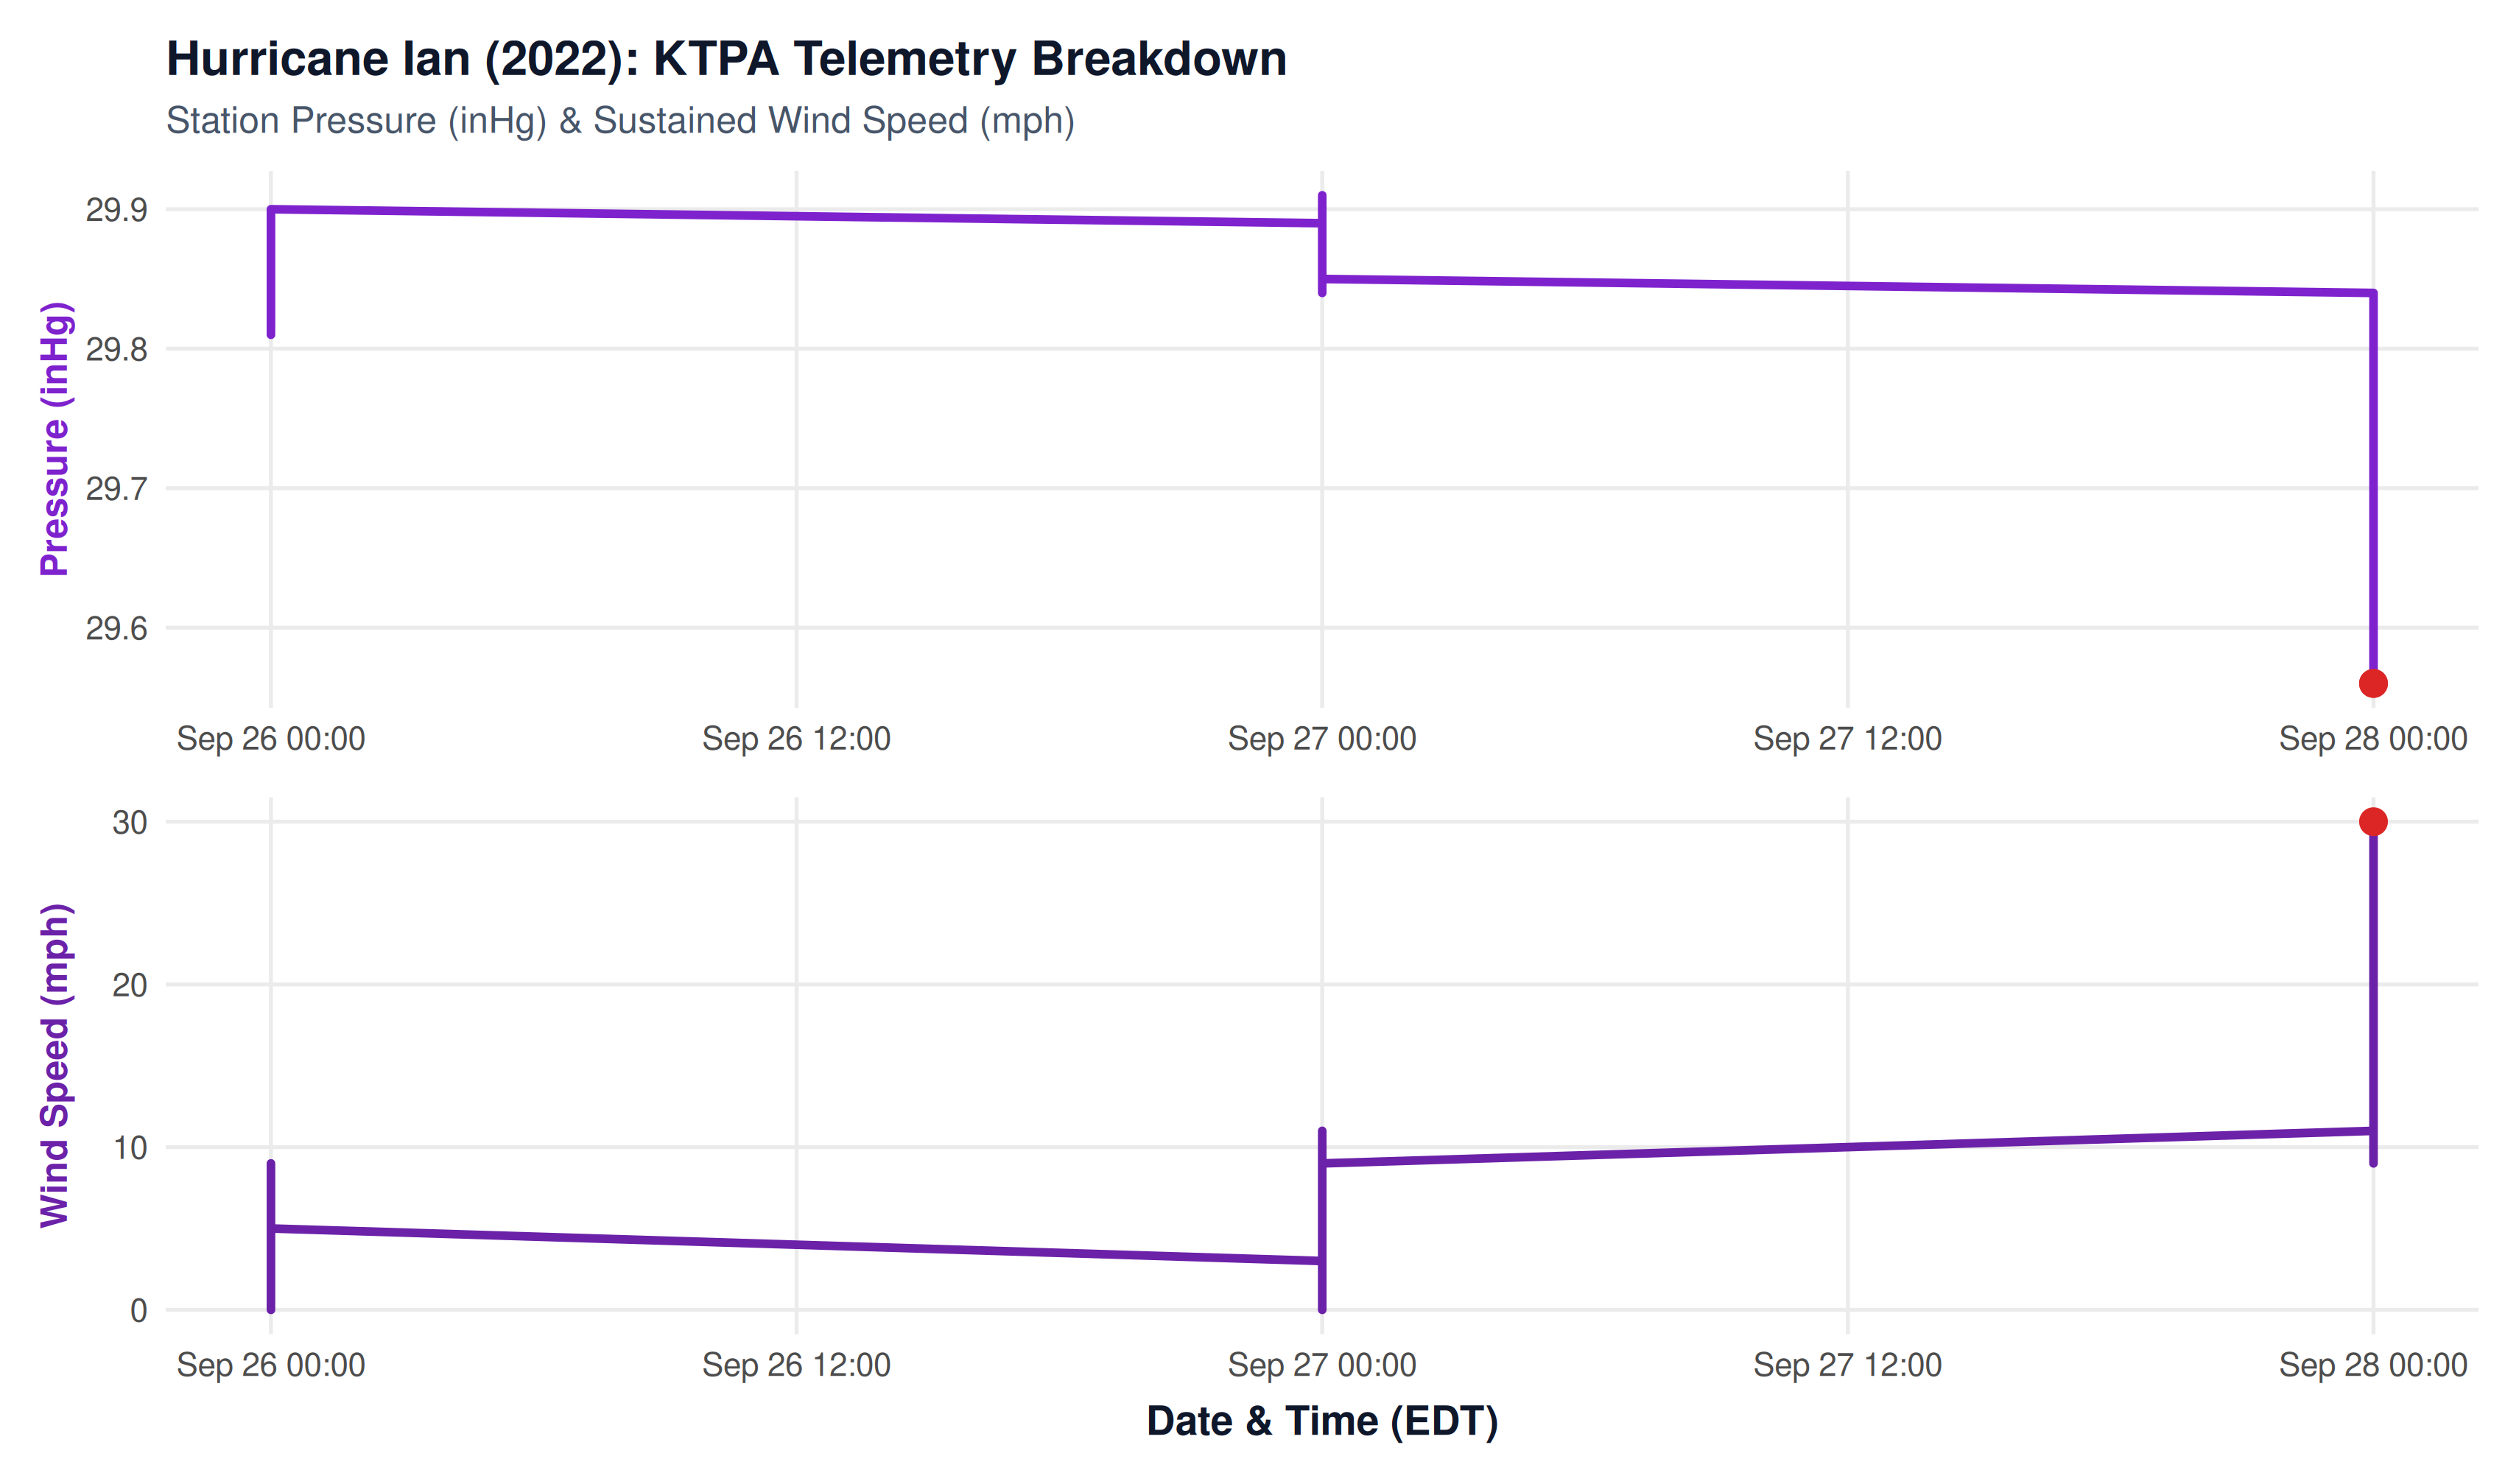
29.56 inHg
Lowest Pressure
1001.0 hPa on Sep 28
30.0 mph
Peak Sustained Wind
Gusts to 50+ mph in squalls
1.83 in
Storm Rainfall
Track shifted south of bay
-5.5 ft Blowout
Seabed Exposure
Historic negative surge
Synoptic Evolution & Last-Minute Track Shift
In late September 2022, Hurricane Ian intensified into a monstrous high-end Category 4/5 cyclone over the southeastern Gulf. Initial NHC forecast tracks pointed toward a catastrophic worst-case direct landfall inside Tampa Bay, triggering mandatory evacuations of over 300,000 residents across Hillsborough and Pinellas counties.
On the morning of September 28, Ian executed an eastward turn, making landfall 85 miles south at Cayo Costa / Fort Myers with 150+ mph winds. While Tampa Bay was spared a catastrophic direct surge, the southern landfall track created a historic meteorological phenomenon.
Meteorological Telemetry at KTPA
Because Ian made landfall to the south, Tampa Bay sat squarely on the cold, offshore northern quadrant of the storm:
- Extreme Negative Surge: Northerly and northeasterly winds blowing between 30 and 45 mph literally siphoned water out of Tampa Bay, lowering water levels to 5.5 feet below normal. Hillsborough Bay, Bayshore Boulevard, and Davis Island basins became barren mudflats where residents famously walked on the dry bay floor.
- Pressure Drop: Station pressure dropped to 29.56 inHg at KTPA on the evening of September 28 as Ian crossed the southern peninsula.
- Spared Catastrophic Deluge: Because Ian’s core rain shield drifted across central and southern Florida, KTPA received 1.83 inches of rain, escaping the 15–20 inch deluges recorded just miles to the south in Sarasota and Lee counties.
Hurricane Ian Landfall: Shape, Rotation & Wind Circulation
The interactive simulation below reconstructs Hurricane Ian at mainland Florida landfall near Cayo Costa / Punta Gorda (Cat 4/5, 150 mph). It visualizes the storm’s massive cyclonic rainbands, counter-clockwise rotation, and the resulting powerful offshore northeasterly winds that famously drained Tampa Bay’s seabed.
REAL-TIME ROTATION SIMULATOR
Hurricane Ian: Animated Cloud Formation & Cyclonic Wind Field
Interactive 60fps canvas simulation: counter-clockwise cyclonic spin of convective cloud bands and wind field points with inward surface inflow deflection.
NoteExplore More Weather Crises
Return to the Natural Disasters Overview to view the full 10-year timeline, comparison tables, and summaries of all major storms.