Hurricane Irma (2017)
MAJOR HURRICANE CASE STUDY
Hurricane Irma (September 2017)
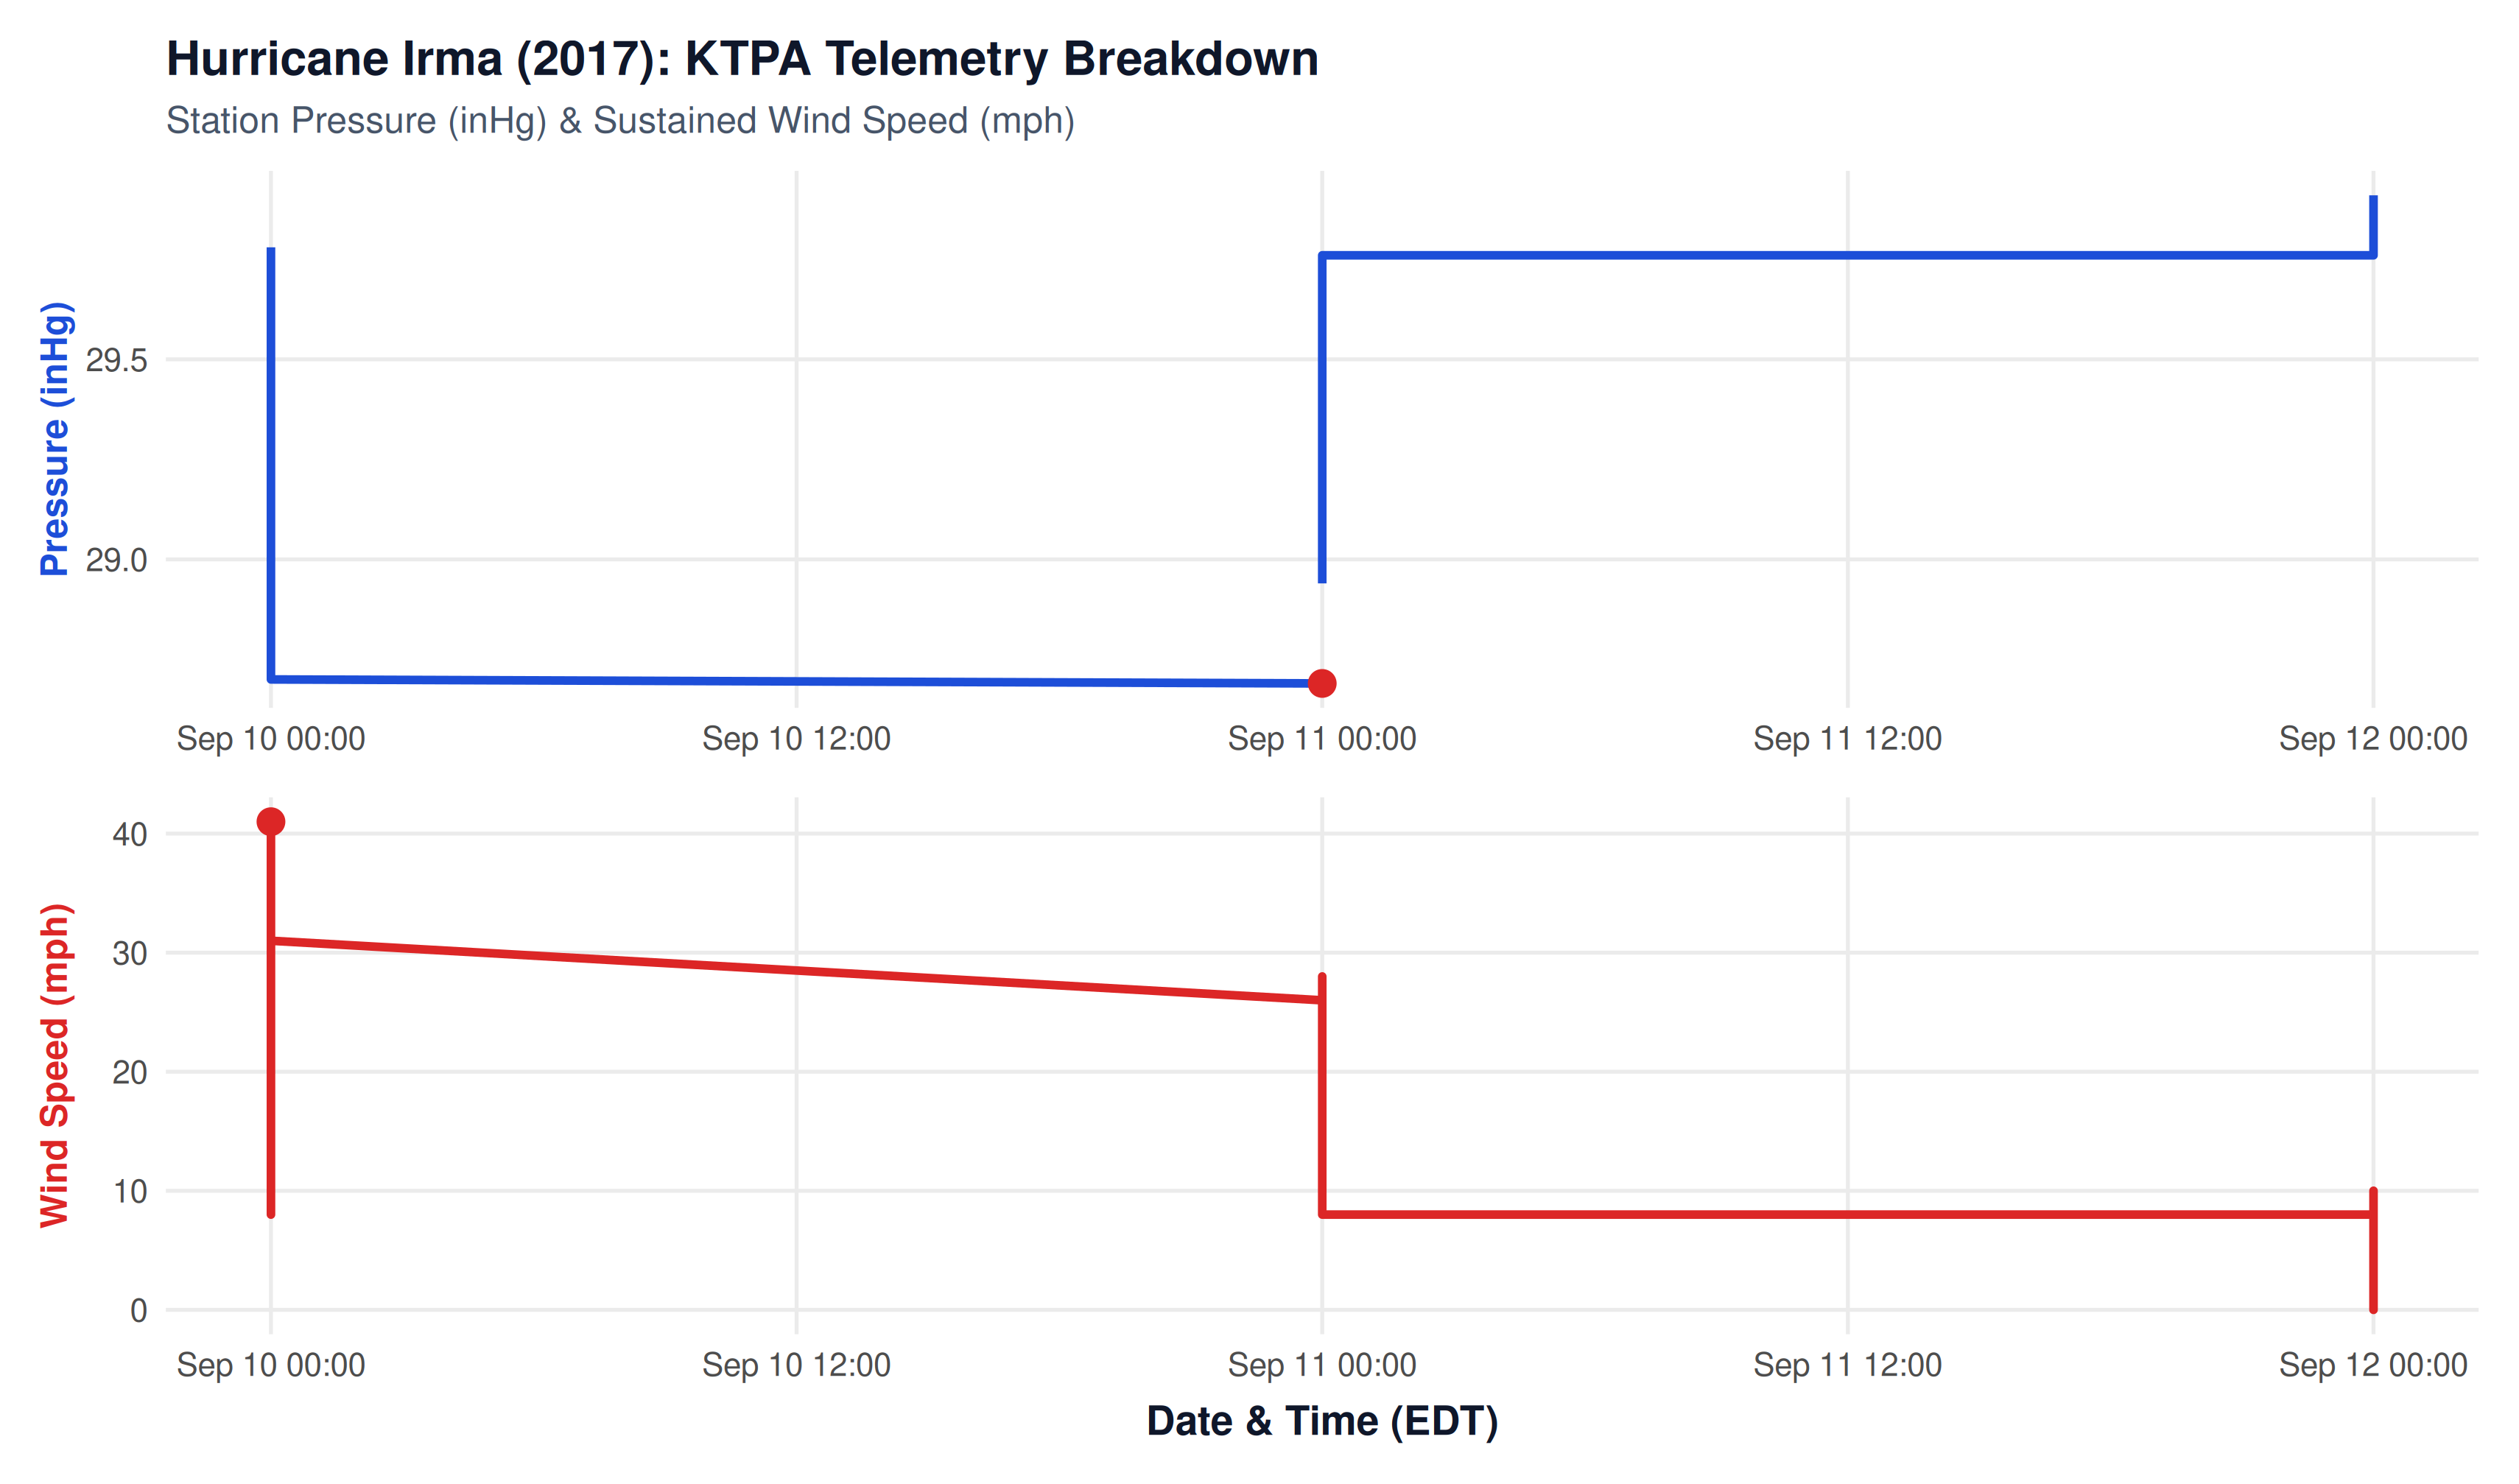
STATION: KTPA • DECADE-RECORD LOW PRESSURE 28.69 inHg
28.69 inHg
Lowest Pressure
Decade all-time record low
41.0 mph
Peak Sustained Wind
Peak squall gusts to 66 mph
4.57 in
Storm Rainfall
Torrential eyewall squalls
Negative Surge
Storm Surge Outcome
Bay completely drained
Synoptic Evolution & Closest Approach
Hurricane Irma was one of the most powerful Atlantic hurricanes on record, maintaining Category 5 intensity for three consecutive days with peak winds of 185 mph across the Caribbean. After making landfall in the Florida Keys as a Category 4 hurricane on September 10, Irma tracked northward up the interior spine of the Florida peninsula, passing just 25 miles east of Tampa during the pre-dawn hours of September 11.
The system’s close eastern transit placed Tampa Bay squarely in the storm’s powerful northwestern eyewall quadrant, subjecting the region to intense wind forces and an unprecedented barometric collapse.
Meteorological Telemetry at KTPA
Telemetry recorded at Tampa International Airport captured the single most violent pressure fluctuation in the station’s modern digital record:
- Decade-Record Low Barometer: Station pressure plummeted from 29.95 inHg down to an astonishing 28.69 inHg (971.5 hPa) at 2:00 AM on September 11 as the eyewall skirted Polk and eastern Hillsborough counties.
- The “Negative Surge” Phenomenon: Because Irma tracked east of Tampa, its counterclockwise circulation drove strong winds out of the northeast and east. Instead of pushing Gulf water into Tampa Bay, these offshore winds blew water out of Hillsborough Bay and Old Tampa Bay, draining the seabed and exposing mudflats for miles.
- High-Velocity Wind Damage: Sustained winds peaked at 41 to 46 mph with violent squall gusts recorded up to 66 mph, snapping mature oak canopies and leaving over 70% of the metropolitan area without electrical power.
Hurricane Irma Landfall: Shape, Rotation & Wind Circulation
The interactive simulation below reconstructs Hurricane Irma at mainland Florida landfall at Marco Island (Cat 3, 115 mph). It visualizes the storm’s cyclonic rainbands, counter-clockwise rotation, and the resulting offshore surface winds that drained Tampa Bay.
REAL-TIME ROTATION SIMULATOR
Hurricane Irma: Animated Cloud Formation & Cyclonic Wind Field
Interactive 60fps canvas simulation: counter-clockwise cyclonic spin of convective cloud bands and wind field points with inward surface inflow deflection.
NoteExplore More Weather Crises
Return to the Natural Disasters Overview to view the full 10-year timeline, comparison tables, and summaries of all major storms.