Hurricane Hermine (2016)
CATEGORY 1 TROPICAL CYCLONE
Hurricane Hermine (September 2016)
STATION: KTPA • END OF FLORIDA’S 11-YEAR HURRICANE DROUGHT
29.77 inHg
Lowest Pressure
1008.1 hPa on Sep 1
30.0 mph
Peak Sustained Wind
Outer gale bands (gusts 40+)
6.67 in
Storm Rainfall
72-hour feeder band total
2.0 – 3.0 ft
Coastal Surge
Bayshore & Pinellas beaches
Synoptic Evolution & Storm Track
In late August 2016, Tropical Storm Hermine formed in the south-central Gulf of Mexico after traversing Cuba. As it curled northeast toward Florida’s Big Bend, it strengthened into a Category 1 hurricane with 80 mph peak winds. When Hermine made landfall near St. Marks, Florida on September 2, 2016, it officially ended Florida’s unprecedented 11-year streak without a hurricane landfall, stretching back to Hurricane Wilma in October 2005.
Although Hermine’s core tracked roughly 175 miles north-northwest of Tampa Bay, the storm’s extensive south and east quadrants swept broad spiral feeder bands across Hillsborough and Pinellas counties over three consecutive days.
Meteorological Telemetry at KTPA
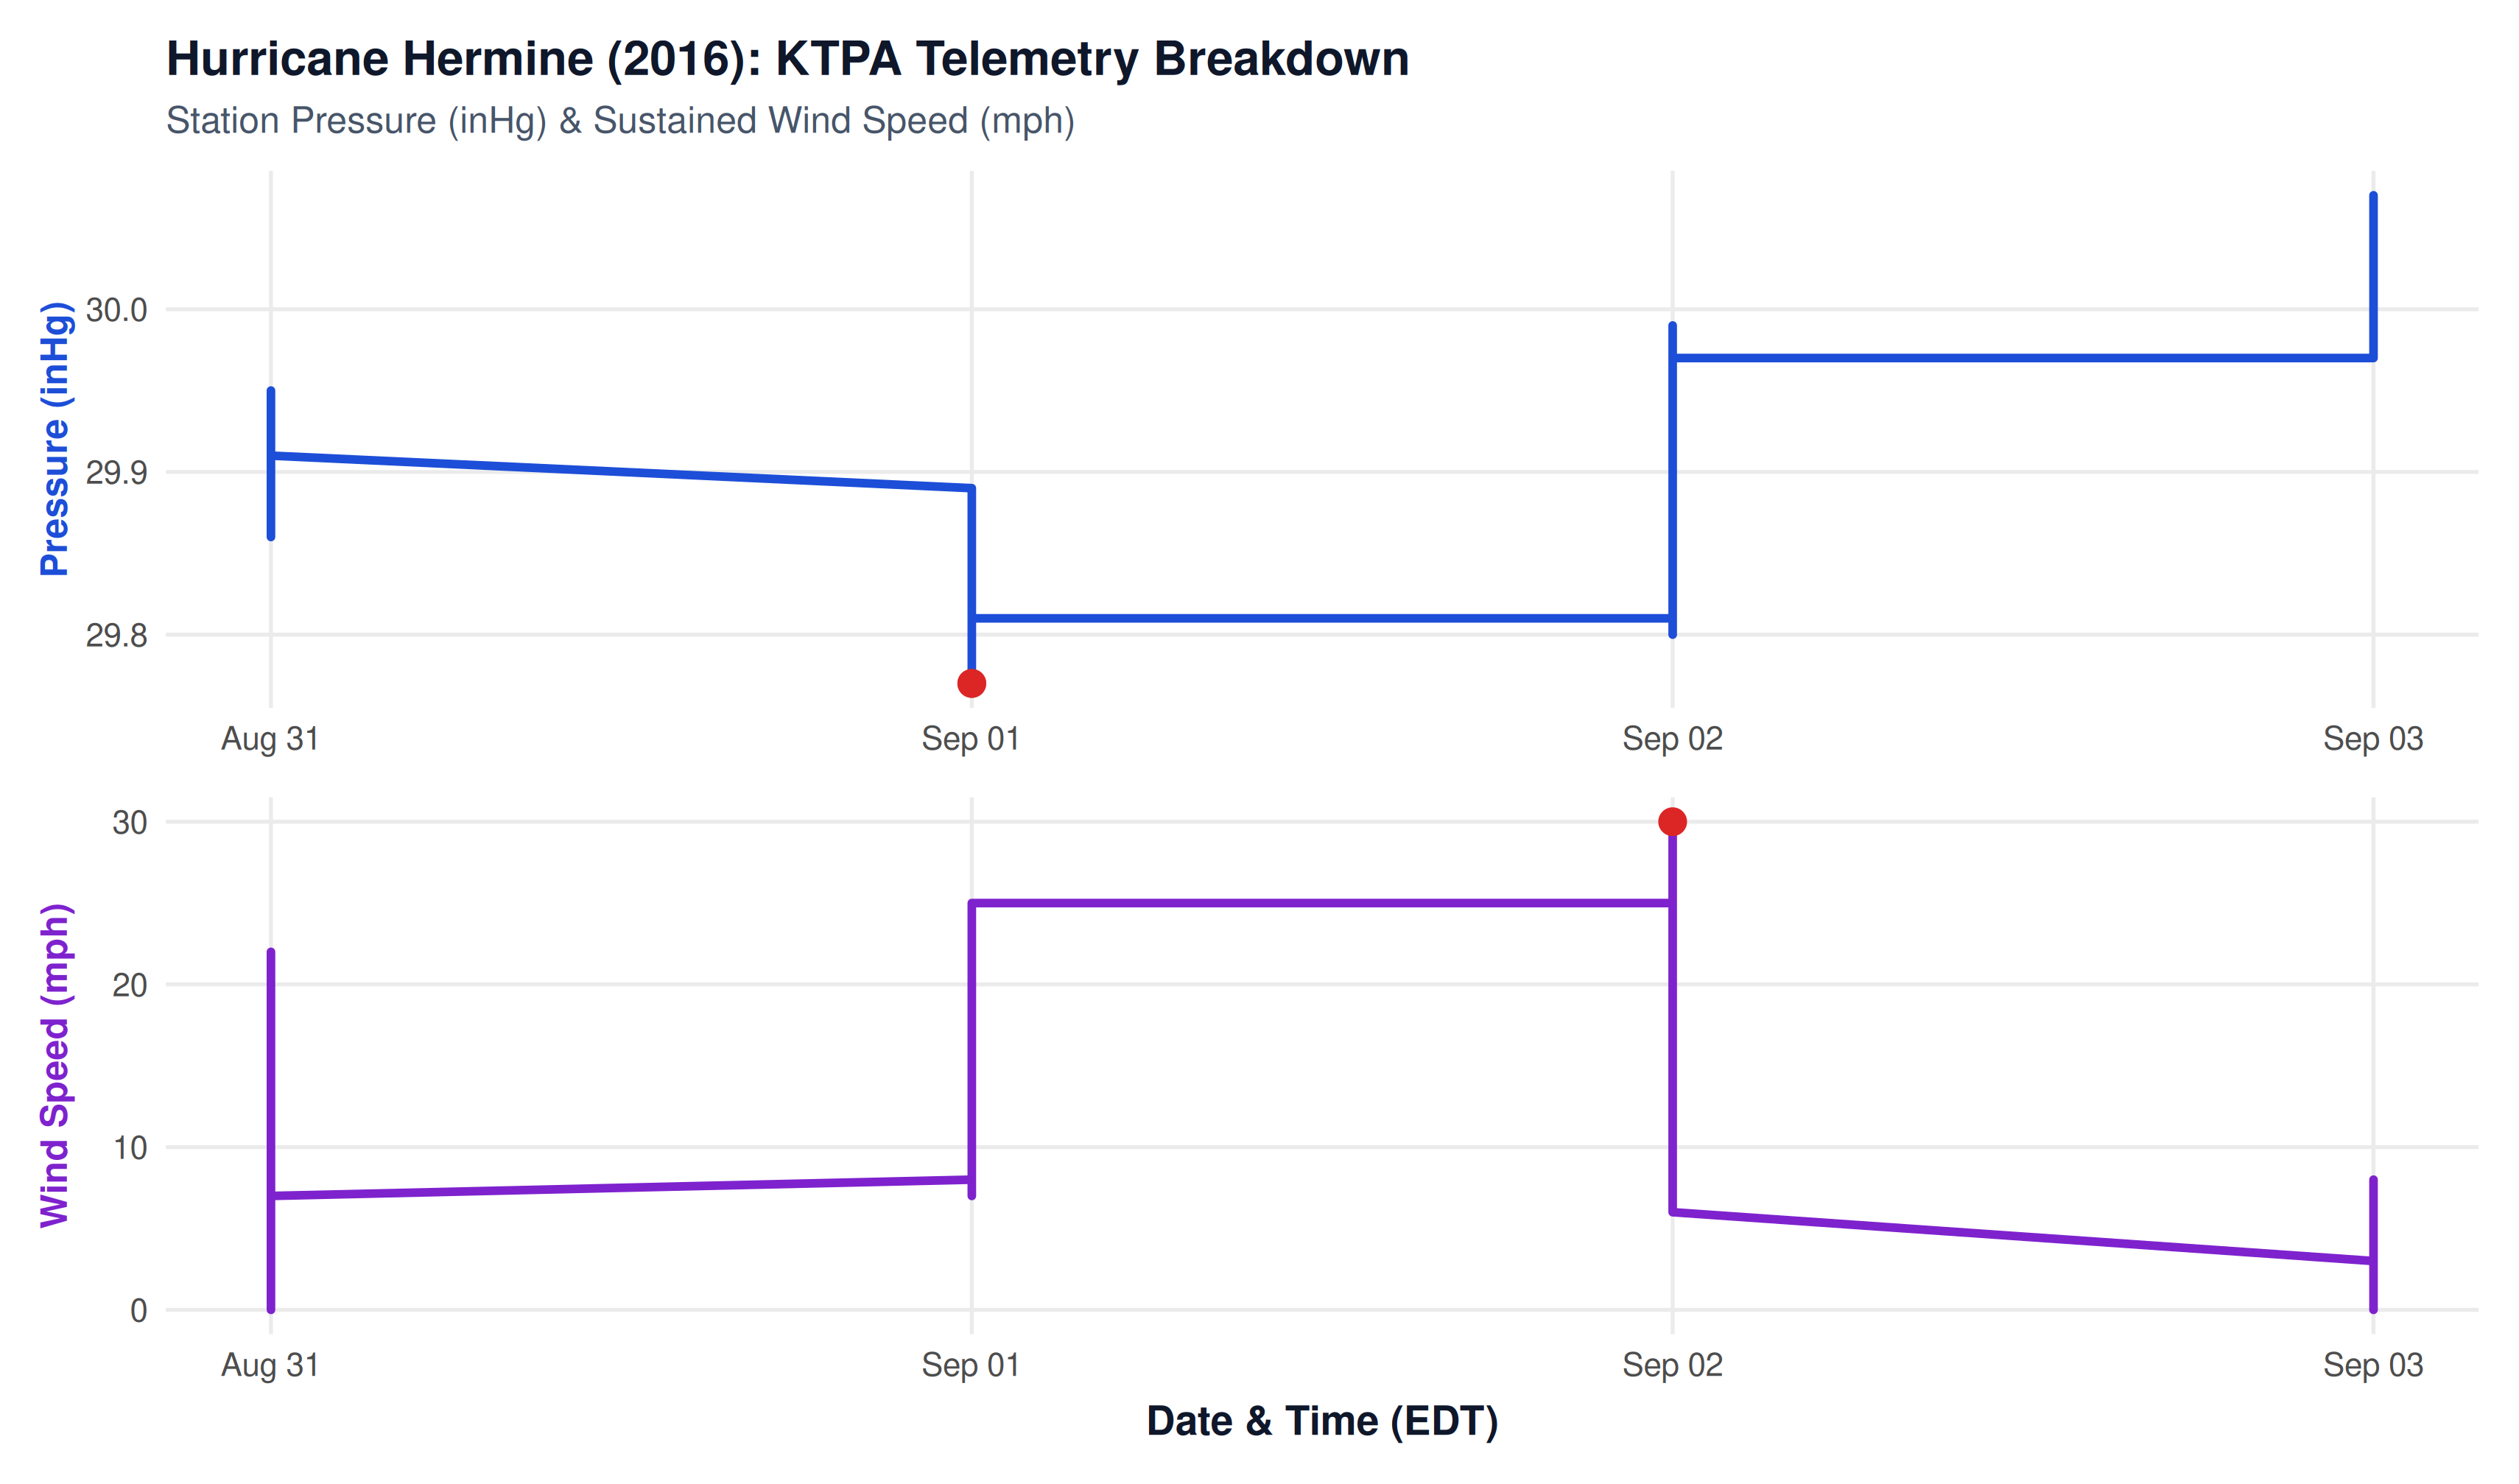
At Tampa International Airport, automated sensors recorded a steady descent in atmospheric pressure beginning on August 31, reaching a minimum of 29.77 inHg as the cyclone pushed into the northeastern Gulf. As the pressure bottomed out:
- Persistent Tropical Gales: Sustained winds held between 20 and 30 mph for nearly 36 hours, punctuated by squall gusts exceeding 40 mph.
- Prolonged Tropical Deluge: Outer feeder bands repeatedly trained over the Tampa metropolitan area, depositing 6.67 inches of rain over the 72-hour period.
- Onshore Surge Inundation: Because Hermine’s counterclockwise circulation pushed sustained southwesterly and westerly winds across the mouth of Tampa Bay, water piled up into Hillsborough and Old Tampa Bay, producing 2 to 3 feet of storm surge that flooded coastal roads and submerged portions of Bayshore Boulevard.
Hurricane Hermine Landfall: Shape, Rotation & Wind Circulation
The interactive simulation below reconstructs Hurricane Hermine at mainland Florida landfall near St. Marks (Cat 1, 80 mph). It visualizes the storm’s cyclonic rainbands, counter-clockwise rotation, and the resulting onshore southwesterly gales that drove coastal surge into Tampa Bay.
REAL-TIME ROTATION SIMULATOR
Hurricane Hermine: Animated Cloud Formation & Cyclonic Wind Field
Interactive 60fps canvas simulation: counter-clockwise cyclonic spin of convective cloud bands and wind field points with inward surface inflow deflection.
NoteExplore More Weather Crises
Return to the Natural Disasters Overview to view the full 10-year timeline, comparison tables, and summaries of all major storms.